The planned path
- 2025Company-reported prototype milestone
- Dec 2026Minimum viable product (MVP)Target · not yet achieved · Dec 2026
- 2027–28Prairie betaPlanned · 2027–28
- Q1 2029Commercial launch in CanadaTarget · not yet achieved · Q1 2029
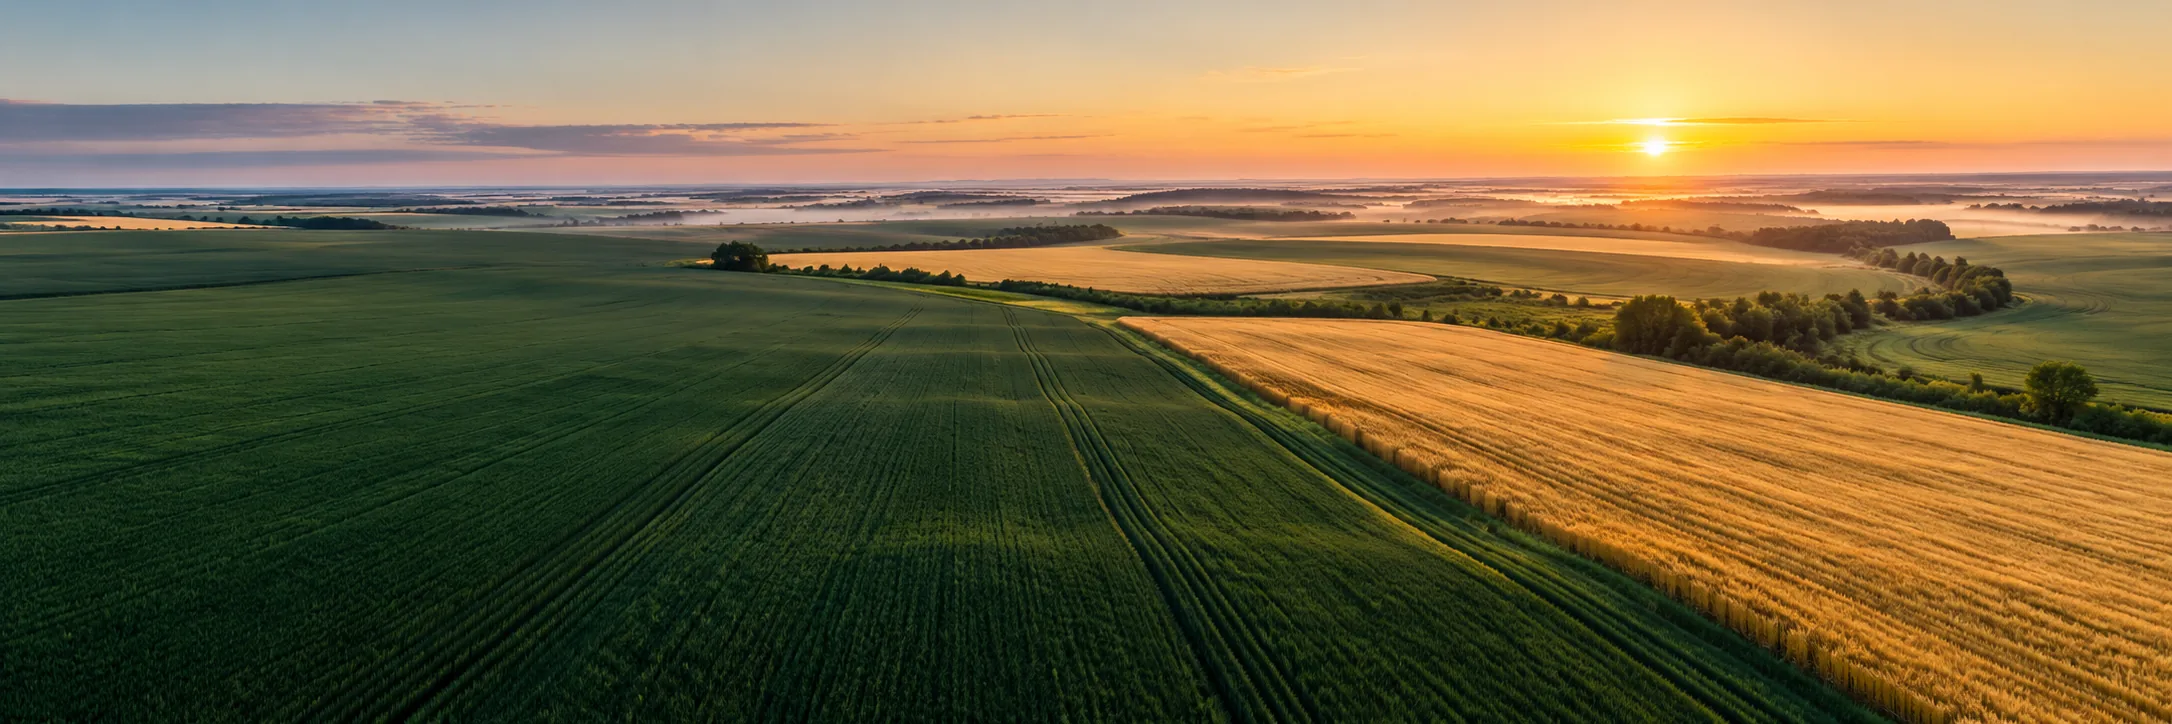
AgriNova AI is developing a satellite-first workflow that brings satellite observations, weather context and your field notes together into one explainable field score and a short list of fields worth checking. Try it on a sample Prairie farm.
Product in development. The demo uses synthetic data. Canadian validation is planned.
Down 11 points since June 5
Observed June 12 (sample season)
North Field has the largest score change of the three fields.
Names and roles of the team developing AgriNova AI.
Canadian validation on Prairie farms; timing and participation remain subject to confirmation.
01Decision trail
One sample field, four steps: what the planned product would show, then what you would do and keep after a field visit.
01 · Signal · Score card
AMI 75 on June 5, 64 on June 12.
02 · Context · Evidence card
Image observed June 12 (sample season).
Cloud 5% · usable area 95%.
Cause not established.
03 · Field check · Task
A comparison to make on the next field visit, not a diagnosis.
04 · Record · Note
A field check that finds nothing still goes on the record.
Planned, not part of this sample
02Why evaluate AgriNova
Score first, layers one click away.
A map shows where a field looks different; this view would put dated scores and a ranked list of all three fields beside the map and show the evidence behind each.
The image date, cloud state and usable area behind every score, and which input families the score would combine.
Input values are planned for real fields; the sample fields on this website have none.
A grower and their agronomist would look at the same scores, evidence and field notes.
03Evidence and examples
Two studies from Iran in 2021, on maize and barley: changes seen in NDVI imagery, followed by checks in the field. Observations only, with no outcome figures, no control plot and no Canadian evidence.
No Canadian result is reported yet. The reporting page lists the records a Canadian case would need first, from farm consent and a baseline to calibrated harvest records and every extra cost.
04Value preview
A worked example on a sample farm with published Saskatchewan yields and prices. Change the area or the yield change to see the most a field-monitoring service could cost per acre per year for these numbers to pay.
At this setting, the most the service could cost for these numbers to pay is about $1.43 per acre per year. Calculated
That is about $3.53 per hectare per year. Calculated
The break-even subscription is a threshold, not a price. AgriNova has not confirmed public pricing.
Each 1% yield change on this farm is worth about $4.73 per acre per year after handling costs. Calculated
| Yield change | Value of the yield change after handling costs | Break-even subscription, per acre per year |
|---|---|---|
| 0% | $0.00 | about −$0.94 (no subscription would pay) |
| +0.5% (example setting) | $1,514.38 | about $1.43 |
| +1% | $3,028.77 | about $3.79 |
| +2% | $6,057.54 | about $8.53 |
Saskatchewan 2025 average (Statistics Canada, revised; accessed 2026-10-04)
Sask. Crop Planning Guide 2026
Alberta Agriculture Statistics Yearbook 2020
The handling cost and the setup are editable assumptions with no external source; change them, and every other cost and saving, in the full calculator.
Method: value of the yield change = yield change × the sum over both crops of area × yield × (price − handling cost per extra bushel); break-even subscription = (that value − setup) ÷ total acres. Numbers are kept at full precision and rounded once for display; a break-even is a threshold, so it reads "about".
05Who it's for
A clearer starting point for deciding where to spend your attention.
A shared view of observations to support your judgement and grower conversations.
A way to help shape practical monitoring workflows for your network.
06Learn
Understand the score
Use a score as a starting point, then check the observations and context behind it.
Observe & investigate
Turn a changing pattern into a focused question you can investigate on the ground.
Next step
Try the field demo